Scan and trace a paper index
The basic steps in this part are:
- Georeference a scanned paper index map with QGIS
- Create a new polygon layer with a ‘label’ or ‘title’ field
- Add polygon features to the new layer by tracing the scanned image
- Export the new layer as a GIS file
Georeference a scanned image
We’ll be using these QGIS plugins:
- Georeferencer
- QuickMapServices
We’ll start with a scanned image of a map–one with lines of latitude and longitude labeled in the map, so that it’s possible to add “ground control points” (GCPs)–points on the scanned paper map that correspond to their real-world locations.
Launch QGIS, and open a new blank project.
Change the project coordinate reference system
Click the Current CRS button in the bottom right of the QGIS status bar, and set to ‘EPSG:4326’.
Your Current CRS should indicate the new CRS:

Now, let’s open the Georeferencer Plugin. This is what we’ll use to add our scanned image, assign GCPs, and tranform the image into geodata.
Open the Georeferencer
In the main QGIS menu, click Raster > Georeferencer. This should open a new window for the Georeferencer Plugin.
Now, let’s add the scanned image of the map to the georeferencer-plugin interface.
Add the scanned image
Click the Add Raster button on the top left of the georeferencer-plugin interface. Navigate to your file, then select Open.
Configure your transformation settings
Click on the Transformation Settings… button in the georeferencer-plugin interface. Configure to these settings:
- Transformation Type: Polynomial 2
- Target SRS: EPSG:4326
- Output Raster: Save to file location (ideally, in a project folder)
- Load in QGIS
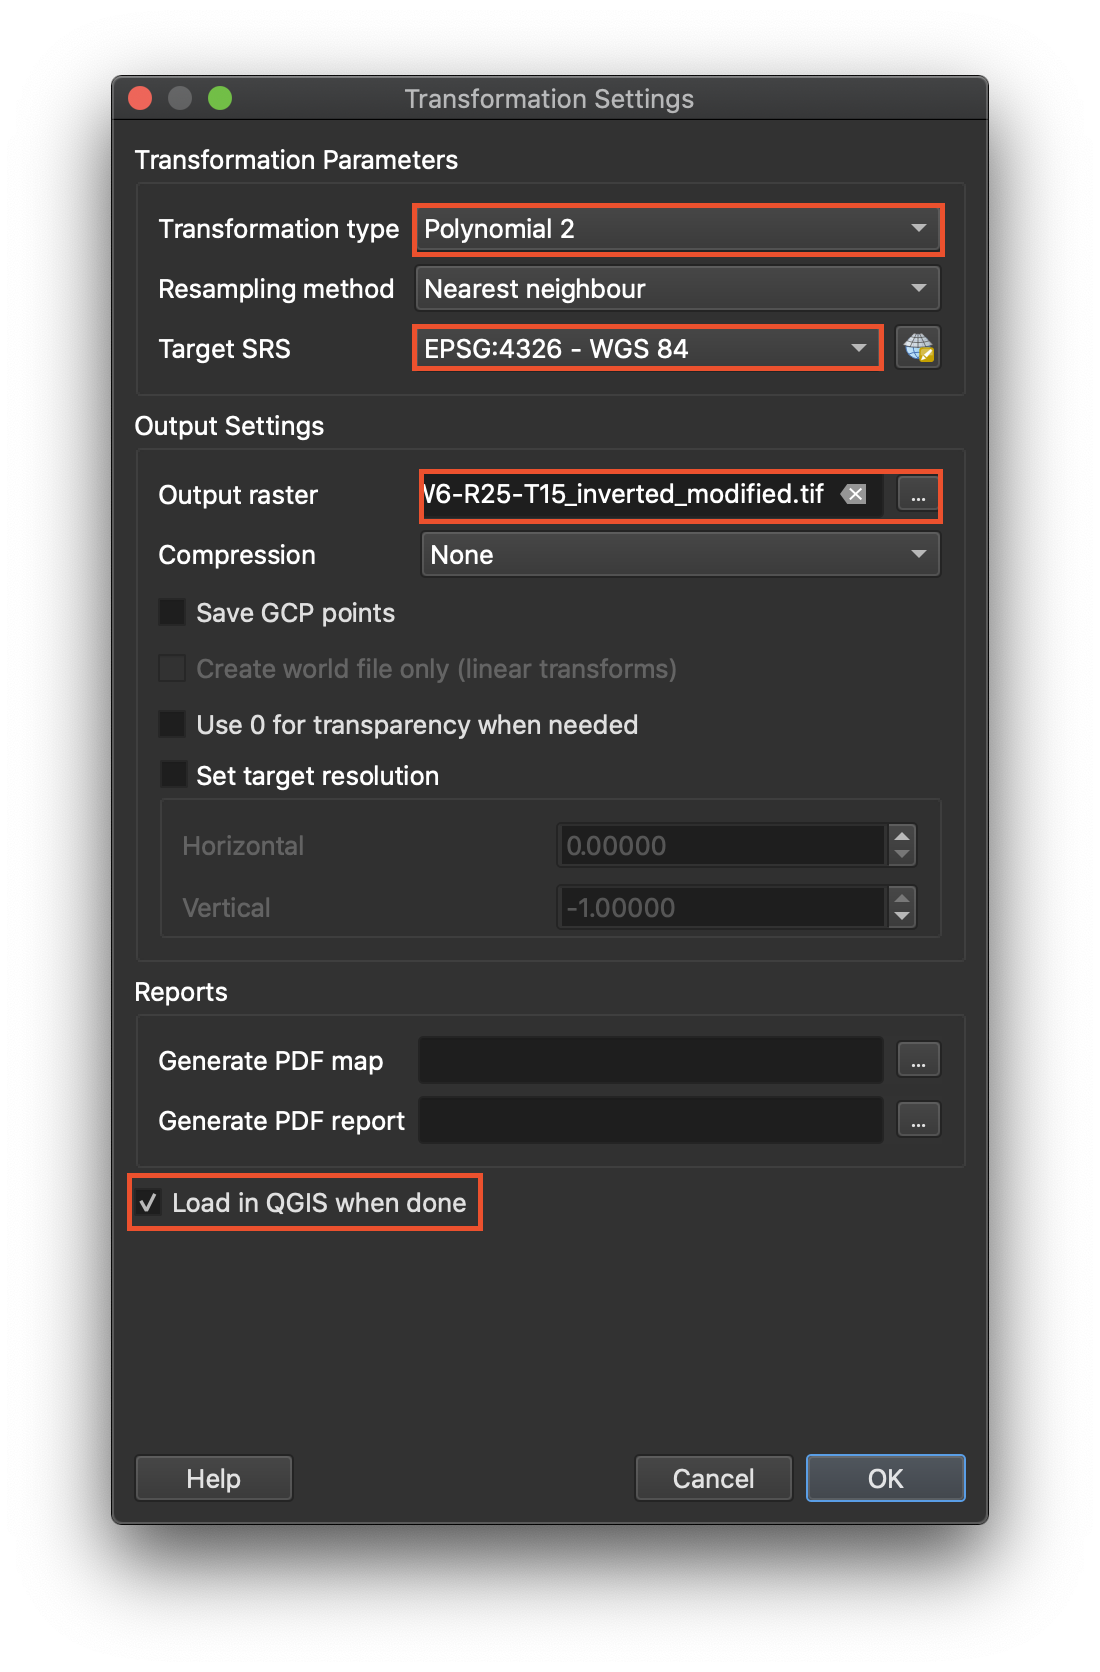
Now, we are ready to begin identifying GCPs on your scanned image. Some maps will have lat/long graticule features. These make it very easy to georeference a map with QGIS’ Georeferencer.
Add ground control points
With the Add Point tool selected, select your first point at a lat/long intersection.
A new window should pop up as soon as you click on the location for your first point, prompting you to add the lat/long information. Enter the information in the appropriate text fields, and click OK.
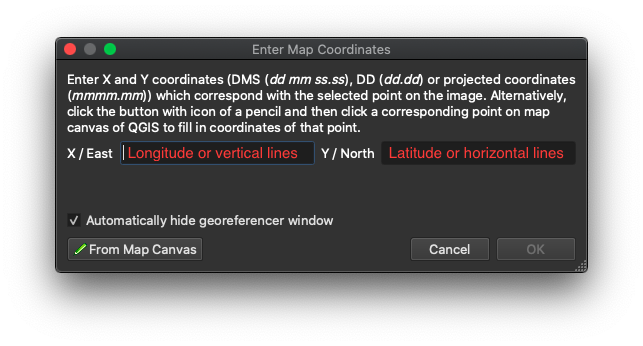
The goal is to add between 6-10 GCPs for each map, with a somewhat-even distribution over the area shown. As a general rule, your residual error should be less than 150. If it exceeds that threshold for any individual point, double-check that point by toggling it on/off in your GCP panel to see if the error improves.
Once you have your 6-10 confidently-accurate points, you can run the transformation.
Run the transformation
In the Georeferencer interface, click the green Start Georeferencing button (looks like a “play” button).
Your image should appear in your new QGIS window. Verify it’s situated in its “real world” location by using a reference layer, such as a layer from the QuickMapServices plugin.
Create a new polygon layer
Before beginning to trace your scanned and georeferenced map image, you will need to first create an empty scratch layer with OpenIndexMap elements as attributes. Using this layer, you’ll add polygons for each sheet shown on the index.
An optional starting point is this pre-made .geojson layer with all of the OIM elements already added:
Add polygon features for each map area
This section uses a QGIS project available here (48 MB .zip).
We’ll be using these toolbars:
- Shape Digitizing Toolbar
- Snapping Toolbar
If you don’t have these enabled, go to View > Toolbars and select each one.
Once you have your QGIS project open, it should look something like this:
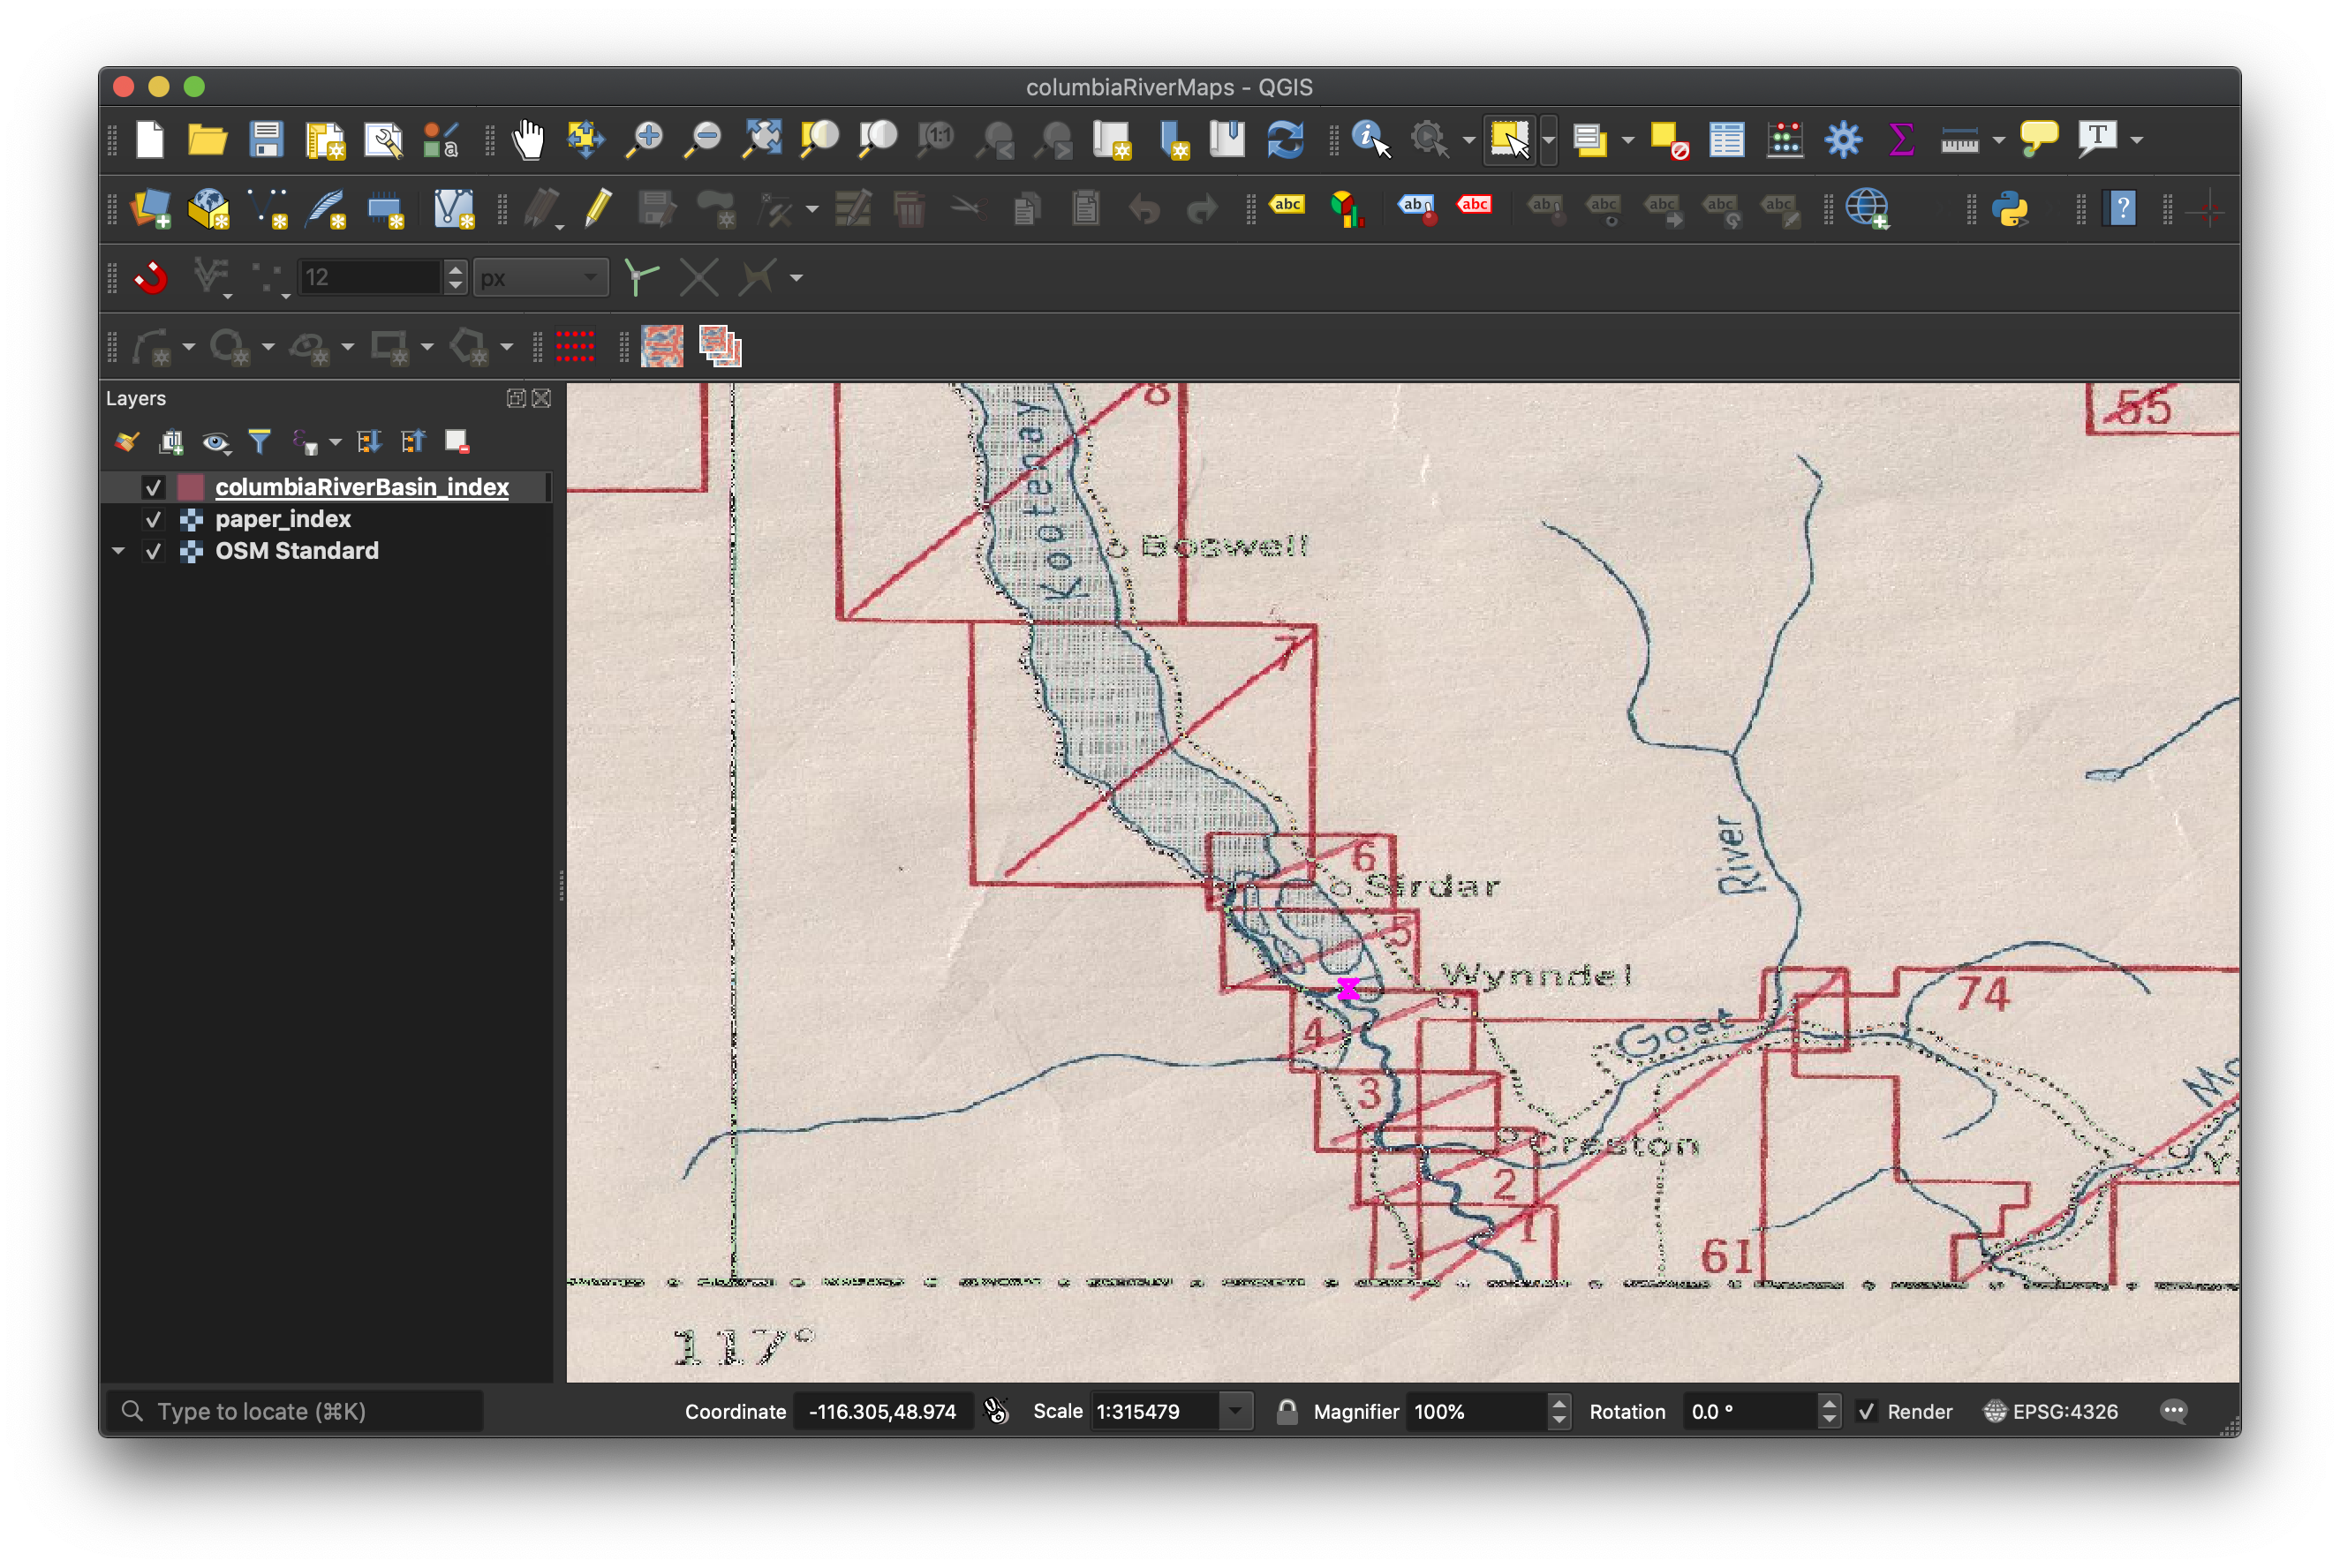
Let’s take a quick look at the attribute table, by right-clicking the layer’s title in the Layers Panel, and selecting Open Attribute Table. There is only one field, ‘label’, with a string data type. This is going to eventually be used as a joining field, or primary key, when we link it with a table of data.
Set snapping rules
Snapping allows us to create polygons exactly next to one another without any gaps between them, just as the map sheets represent. In the Snapping Toolbar, click the magnet to enable the snapping options. Be sure to set the configurations to these settings:
- Set for All Layers
- Snap on Vertex and Segment The remaining settings can be left at the default. Your setting should look something like this:

Open edit session
Now, let’s begin editing the empty layer by adding features.
- Click on your
columbiaRiverBasin_index(or whatever your empty layer’s name is), so that it’s selected in the Layers Panel. - Click the Toggle Editing button in your toolbar to start an edit session. This opens up the layer to be modified.
Begin tracing features
For each box on the scanned paper index, we will create a new feature in our empty layer. One by one, this will become a digital index, which we will eventually export to be joined with more tabular data about each map sheet. Before starting, make sure you’re in edit mode for the empty layer, and that you have enabled the Shape Digitizing Toolbar.
In the Shape Digitizing Toolbar, select Add Rectangle from Extent. This will turn your cursor into a crosshair, which means QGIS is waiting for you to select your first point of the rectangle.

With your mouse, click a corner of one of the boxes on the scanned paper map, and drag to the opposite corner. When you have created a box that is the same shape and size as the box on the paper, right-click your mouse.
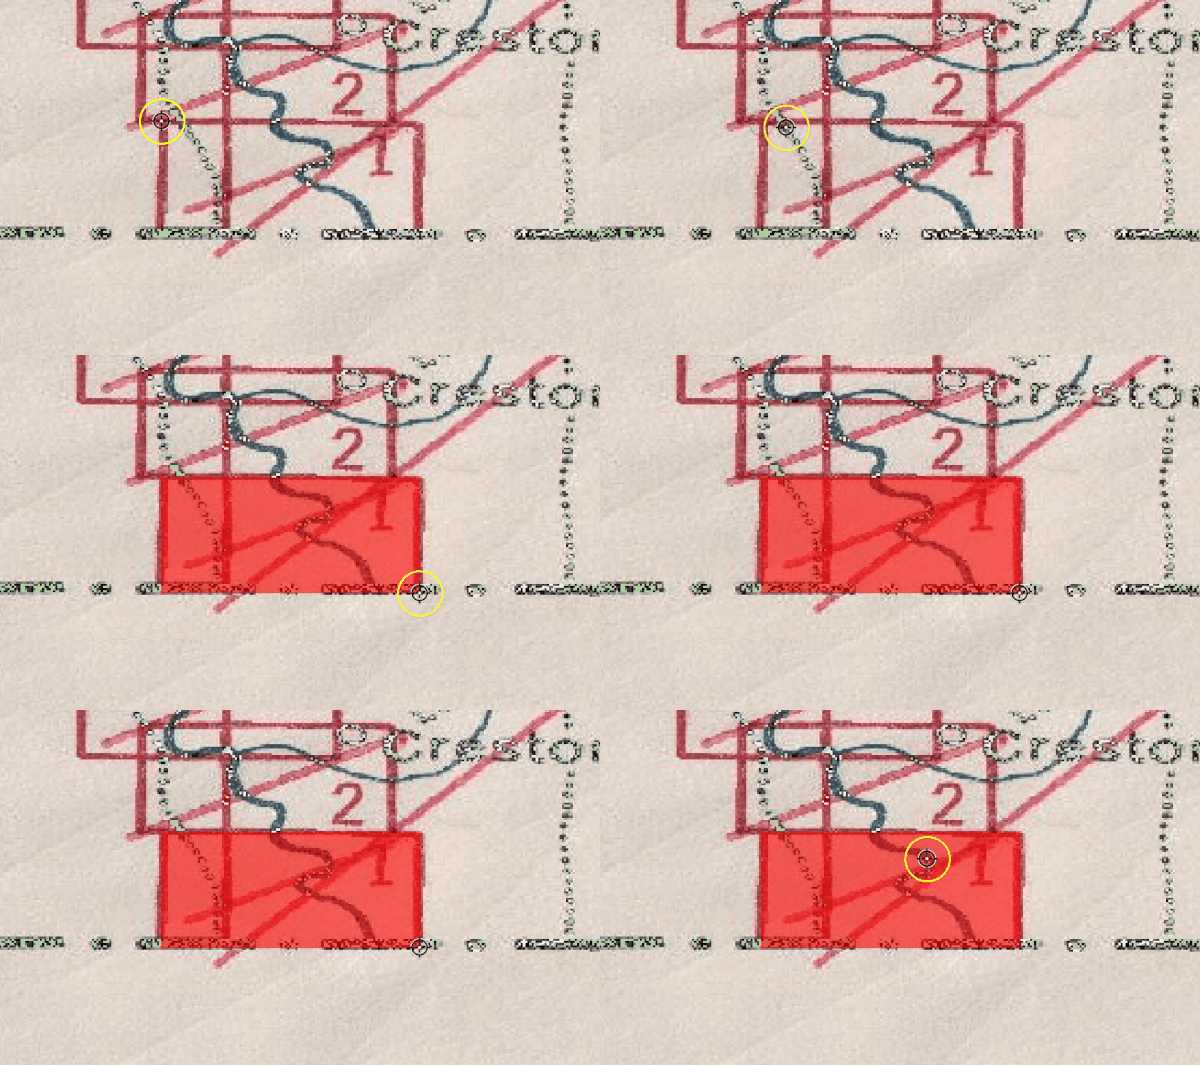
After right-clicking, a window will appear, prompting you to enter values for each attribute field. In this case, we just have ‘label’, but there could be others to enter here too, depending on the assignment. Enter the ‘label’ exactly as shown. Click OK, and you should see your first polygon.
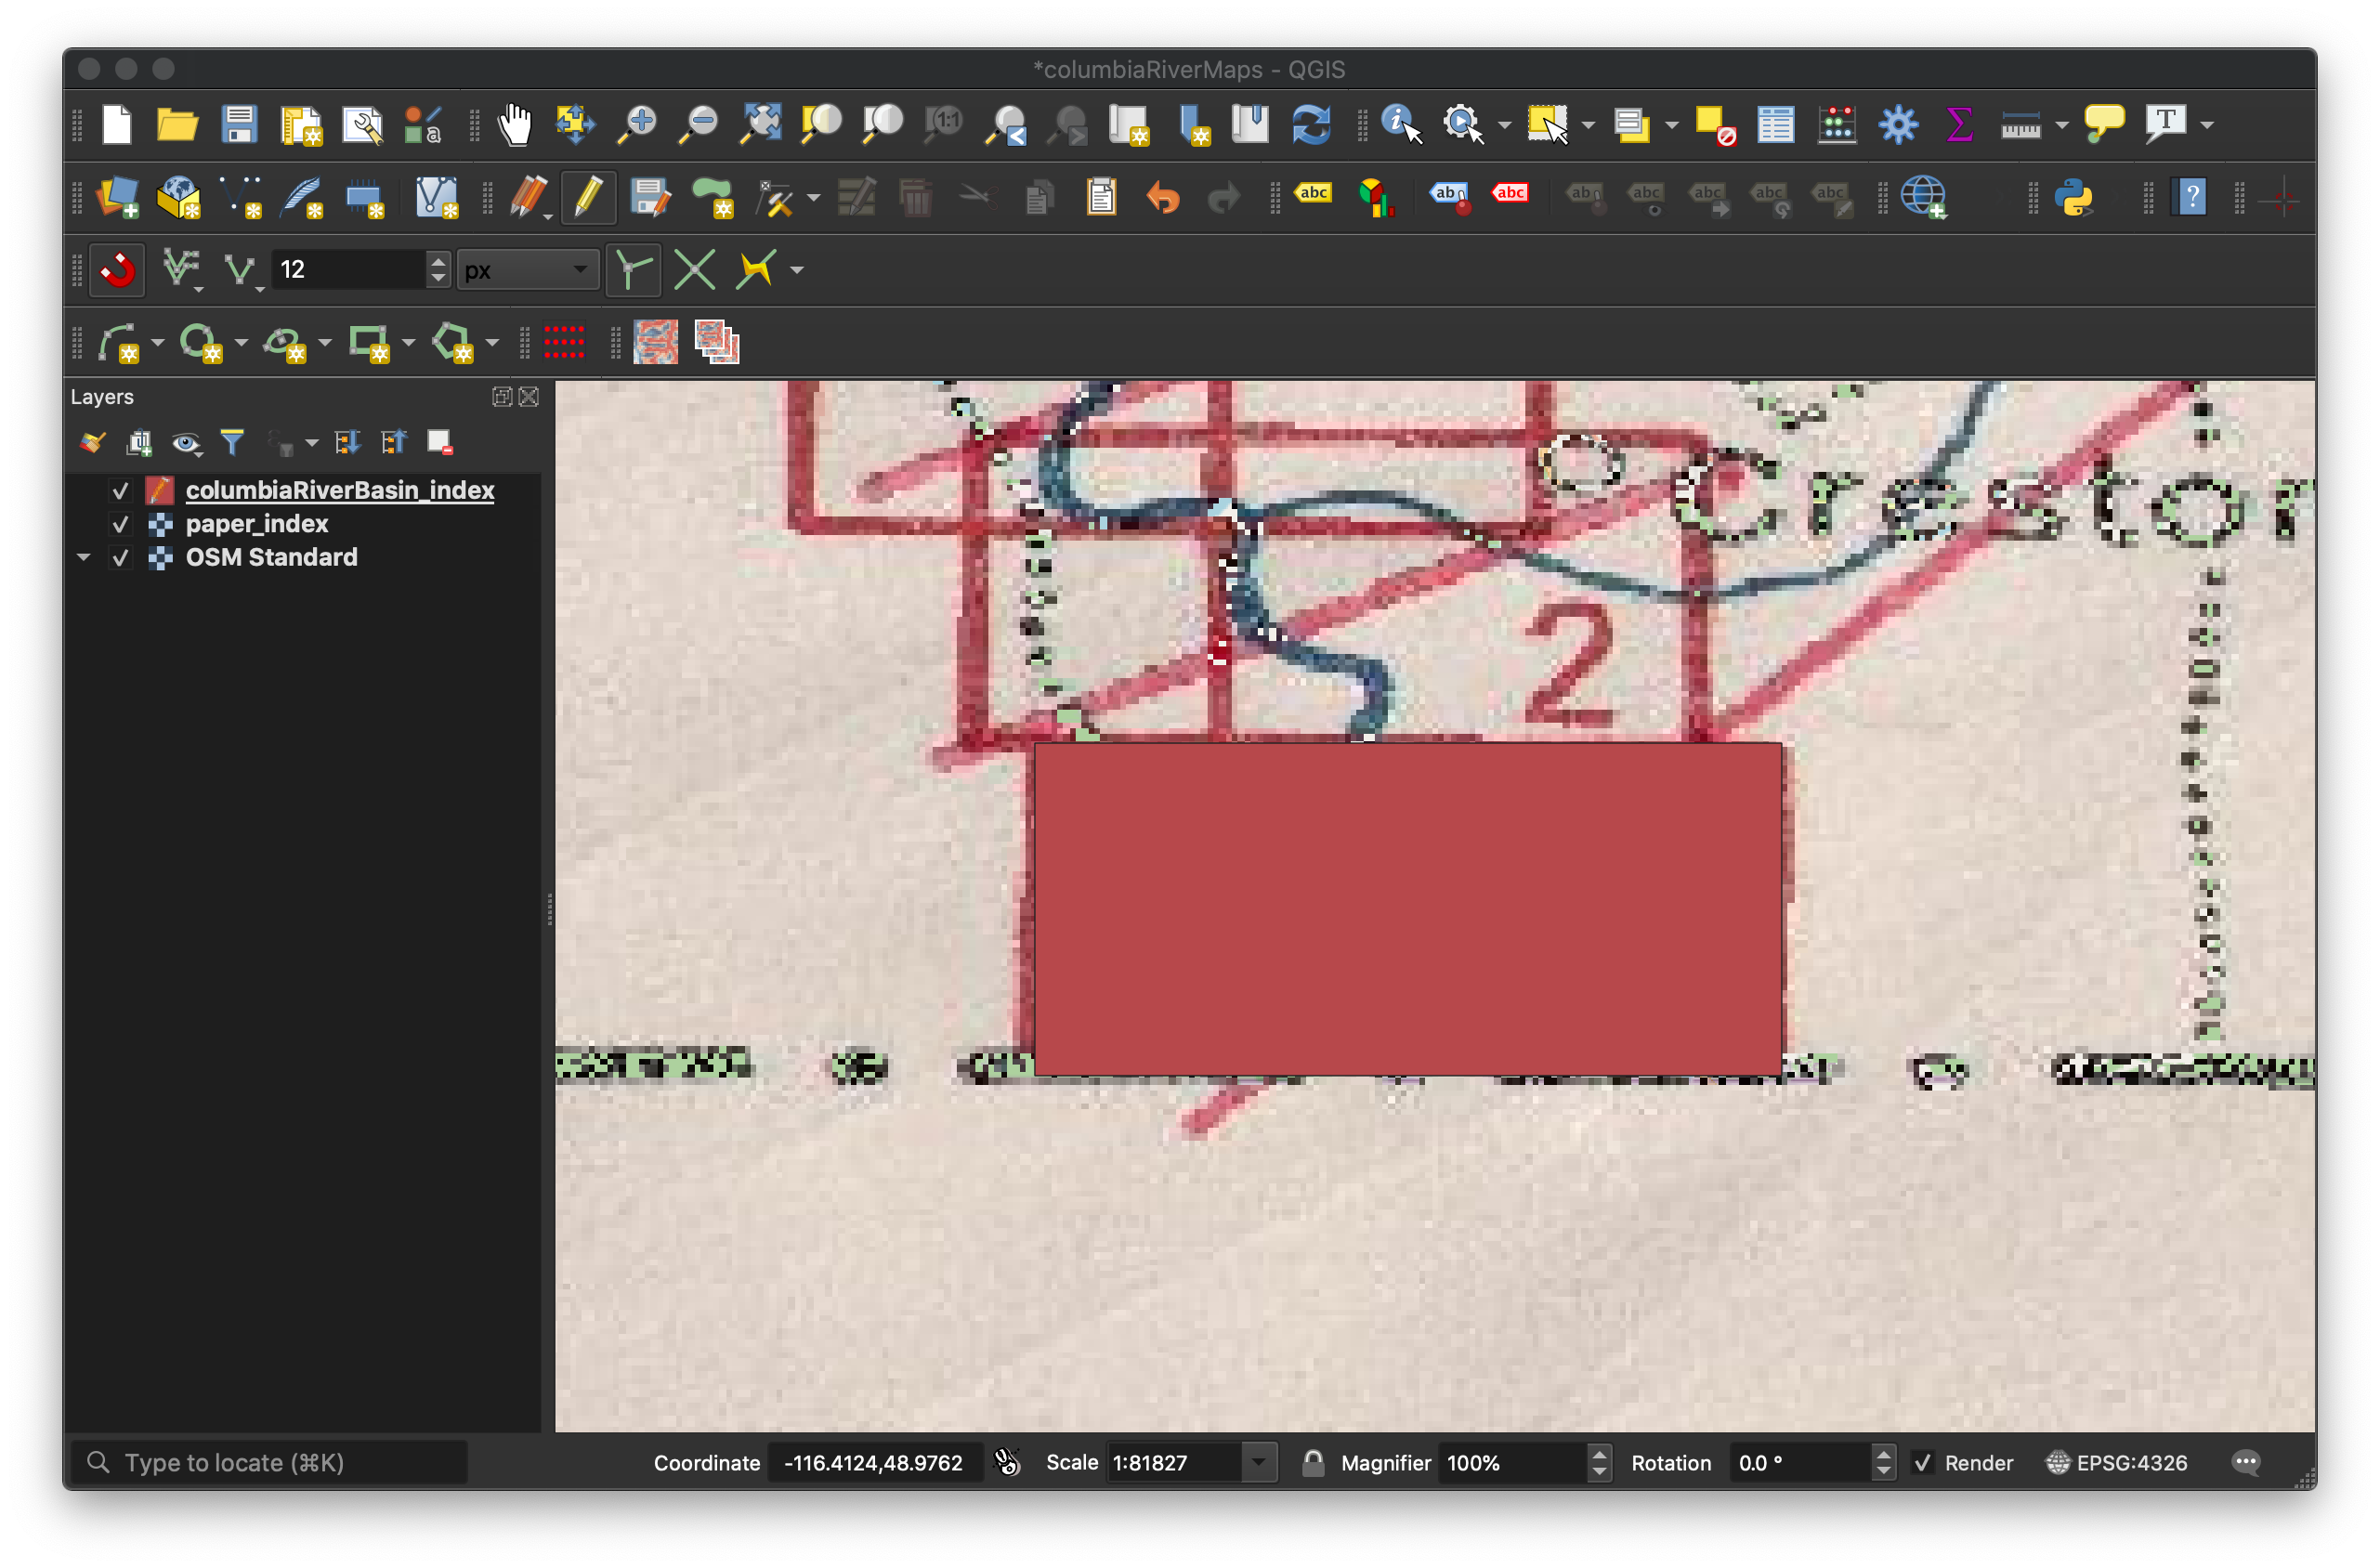
Navigate to your next polygon location by holding the spacebar and moving your cursor.
If you’d like to make your new layer translucent, to better see features on the paper map layer, right-click your layer, and select Properties > Symbology.
The remaining polygons should, ideally, be exactly next to one another. So, we will use the snapping rules we set up earlier. To create your next polygon, start on a segment edge of one you created previously. With snapping enabled, move your cursor next to the polygon edge, and a little pink marker will snap directly to it. Once on the segment, click and drag to create your next polygon, and add your attribute values. Repeat this step for the remaining polygons.
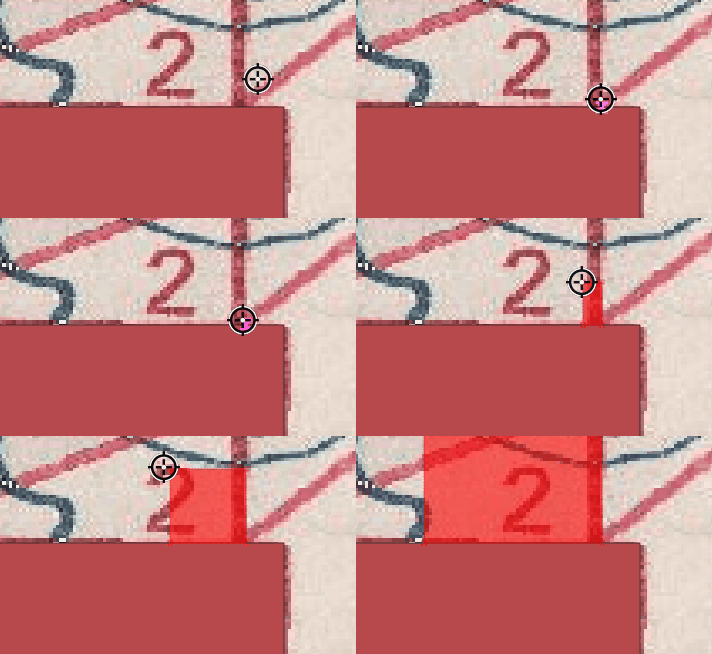
Create irregular, squared-edge shapes
You may encounter some irregularly-shaped maps, which will need more than just a rectangle tool. If these shapes have 90-degree corners, we can create multiple rectangles and merge them together into one.
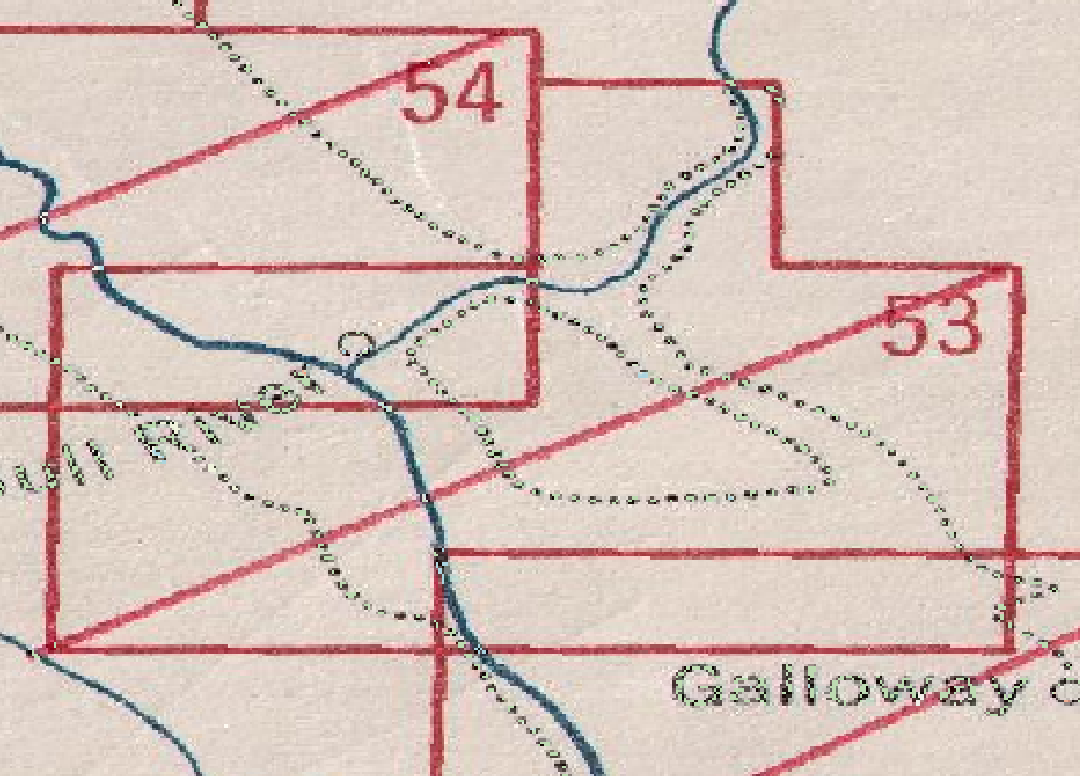
Create two (or more) polygons for each rectangle making up the polygon, using the steps above. When prompted to add attribute values, add the attribute value for only one of the features.
Using the Select Feature(s) tool, select all of the polygons to be merged, so that they are highlighted. To select more than one feature, click and drag across them, or hold the Shift key.
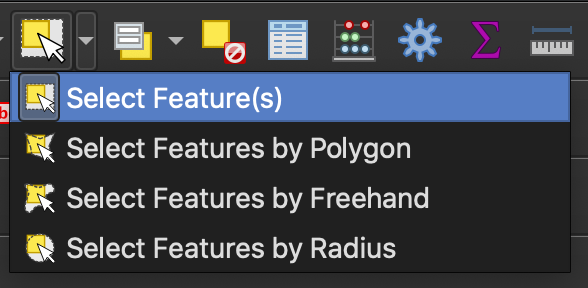
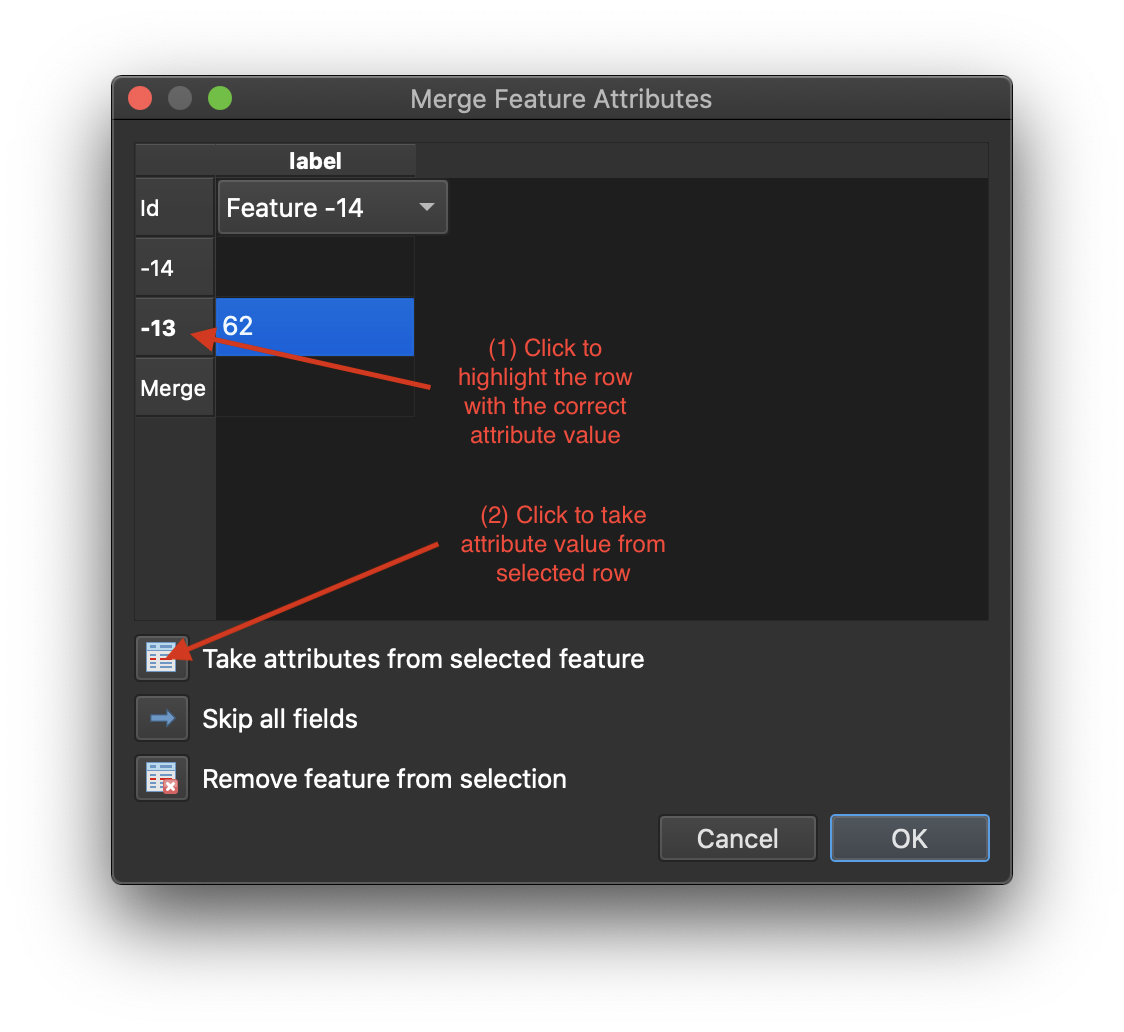
With the features selected, from the main menu, click Edit > Merge Selected Features. This will bring up a new window, where you can specifiy the attribute value for the resulting merged feature. Click to highlight the row with the correct attribute value, then click the option Take attributes from selected feature.
Save and export
Once finished, or when you need a break and want to come back, you can save your edits, features, and project.
-
Save Edits: This can be done incrementally while working on the project, similar to saving a Word doc or other file. Next to the Toggle Editing button, click the Save Layer Edits button. When you are finished with an editing session, click the Toggle Editing button.
-
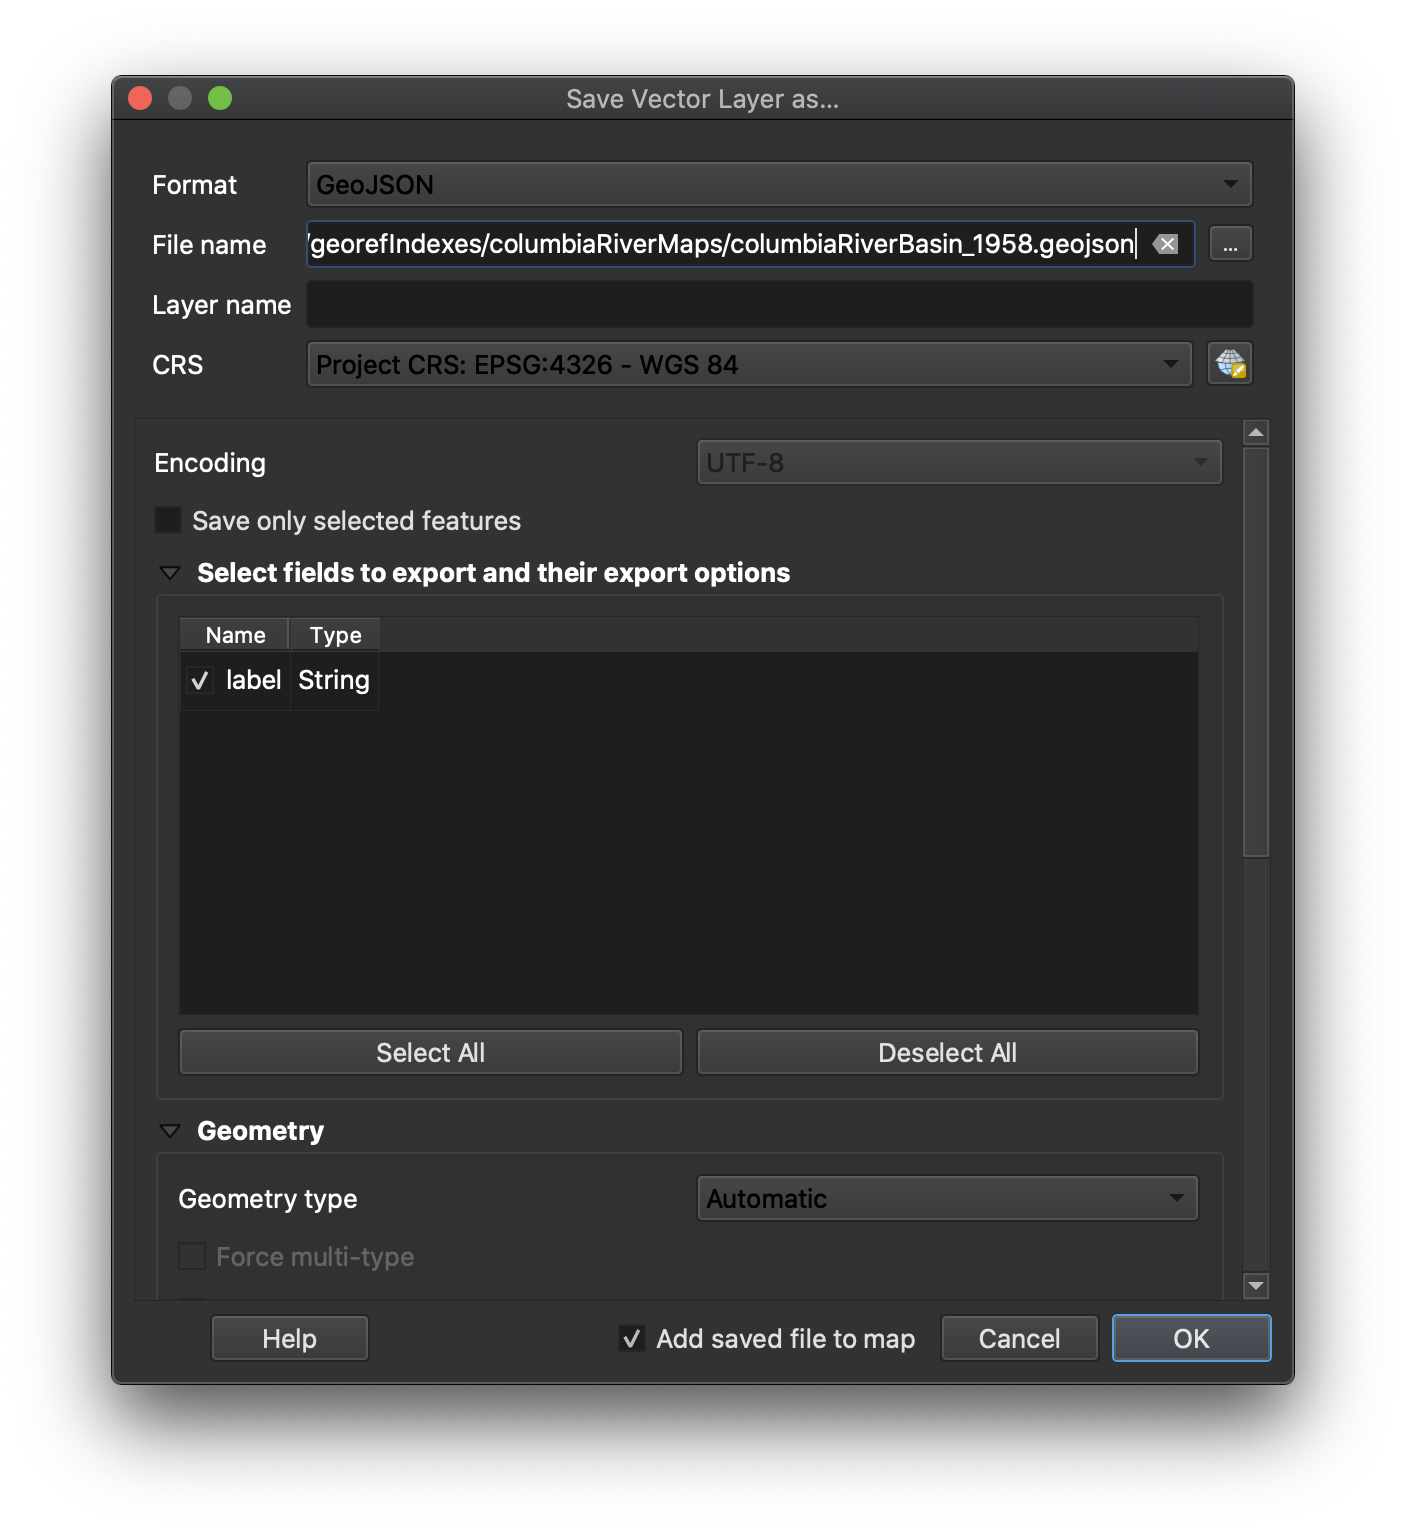
Export Features: Once you’re finished making the new layer of polygons, you can export this as a new file. To do this, right-click the layer’s name in the Layers Panel, and select Export > Save Features As….
In this dialog:
- Format = GeoJSON
- Filename = [country or region]_[scale]_[title or publisher]_[other info].geojson
- CRS = EPSG:4326
Click OK to save.
- Save Project: This will let you close QGIS and come back to your project where you left off. You should do this only after you’ve saved your edits and exported/saved the features. In the main menu, click Project > Save.