Contents: Zoning and Local Area Maps | Transportation Maps | Census Tracts | Maps of Parks | Industrial and Noise Pollution Maps |
Below are the types of maps included in the Koerner Library’s collection that might be of interest in researching the gentrification of Vancouver.
Zoning and Local Area Maps
These maps show the dwelling sizes, commercial, industrial, historical, and agricultural districts of Vancouver. By comparing these maps between key years (for example, the 1970s and 1980s), differences in density and dwelling types can provide evidence of gentrification in specific neighbourhoods.
See all zoning or area maps. Remember that you may be able to find more relevant maps in the Additional Maps page.
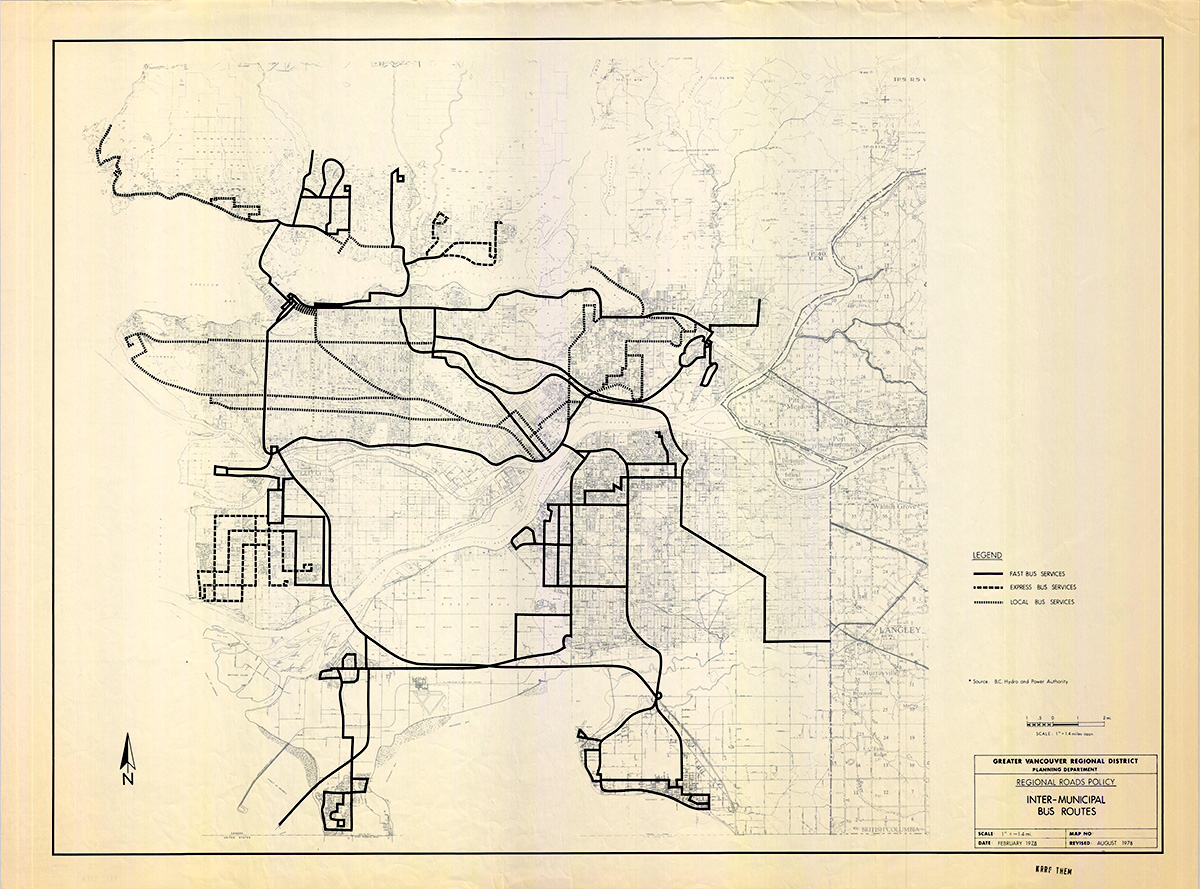
Transportation Maps
Maps that show transportation including public transportation, bike paths, railways, and roadways may have varying connections to gentrification. For example, “elevated highways are … a barrier for investment, thereby limiting the potential for gentrification” (Tolfo & Doucet, 2022). Furthermore, neighbourhoods connected to transportation such as the SkyTrain that allows access to downtown could be areas targeted for gentrification.
See all transportation maps. Remember that you may be able to find more relevant maps in the Additional Maps page.
Census Tracts
The change in census tracts can show the change in density of population or can be used to compare change in median income of different census tracts (which can be found through Statistics Canada) to show the gentrification of an area. For example, in the 1980s, there were about a dozen census tracts in Vancouver’s downtown that formed Vancouver’s largest concentration of poverty; by 2016, this reduced to five census tracts (Tolfo & Doucet, 2022).
See all census tracts maps. Remember that you may be able to find more relevant maps in the Additional Maps page.
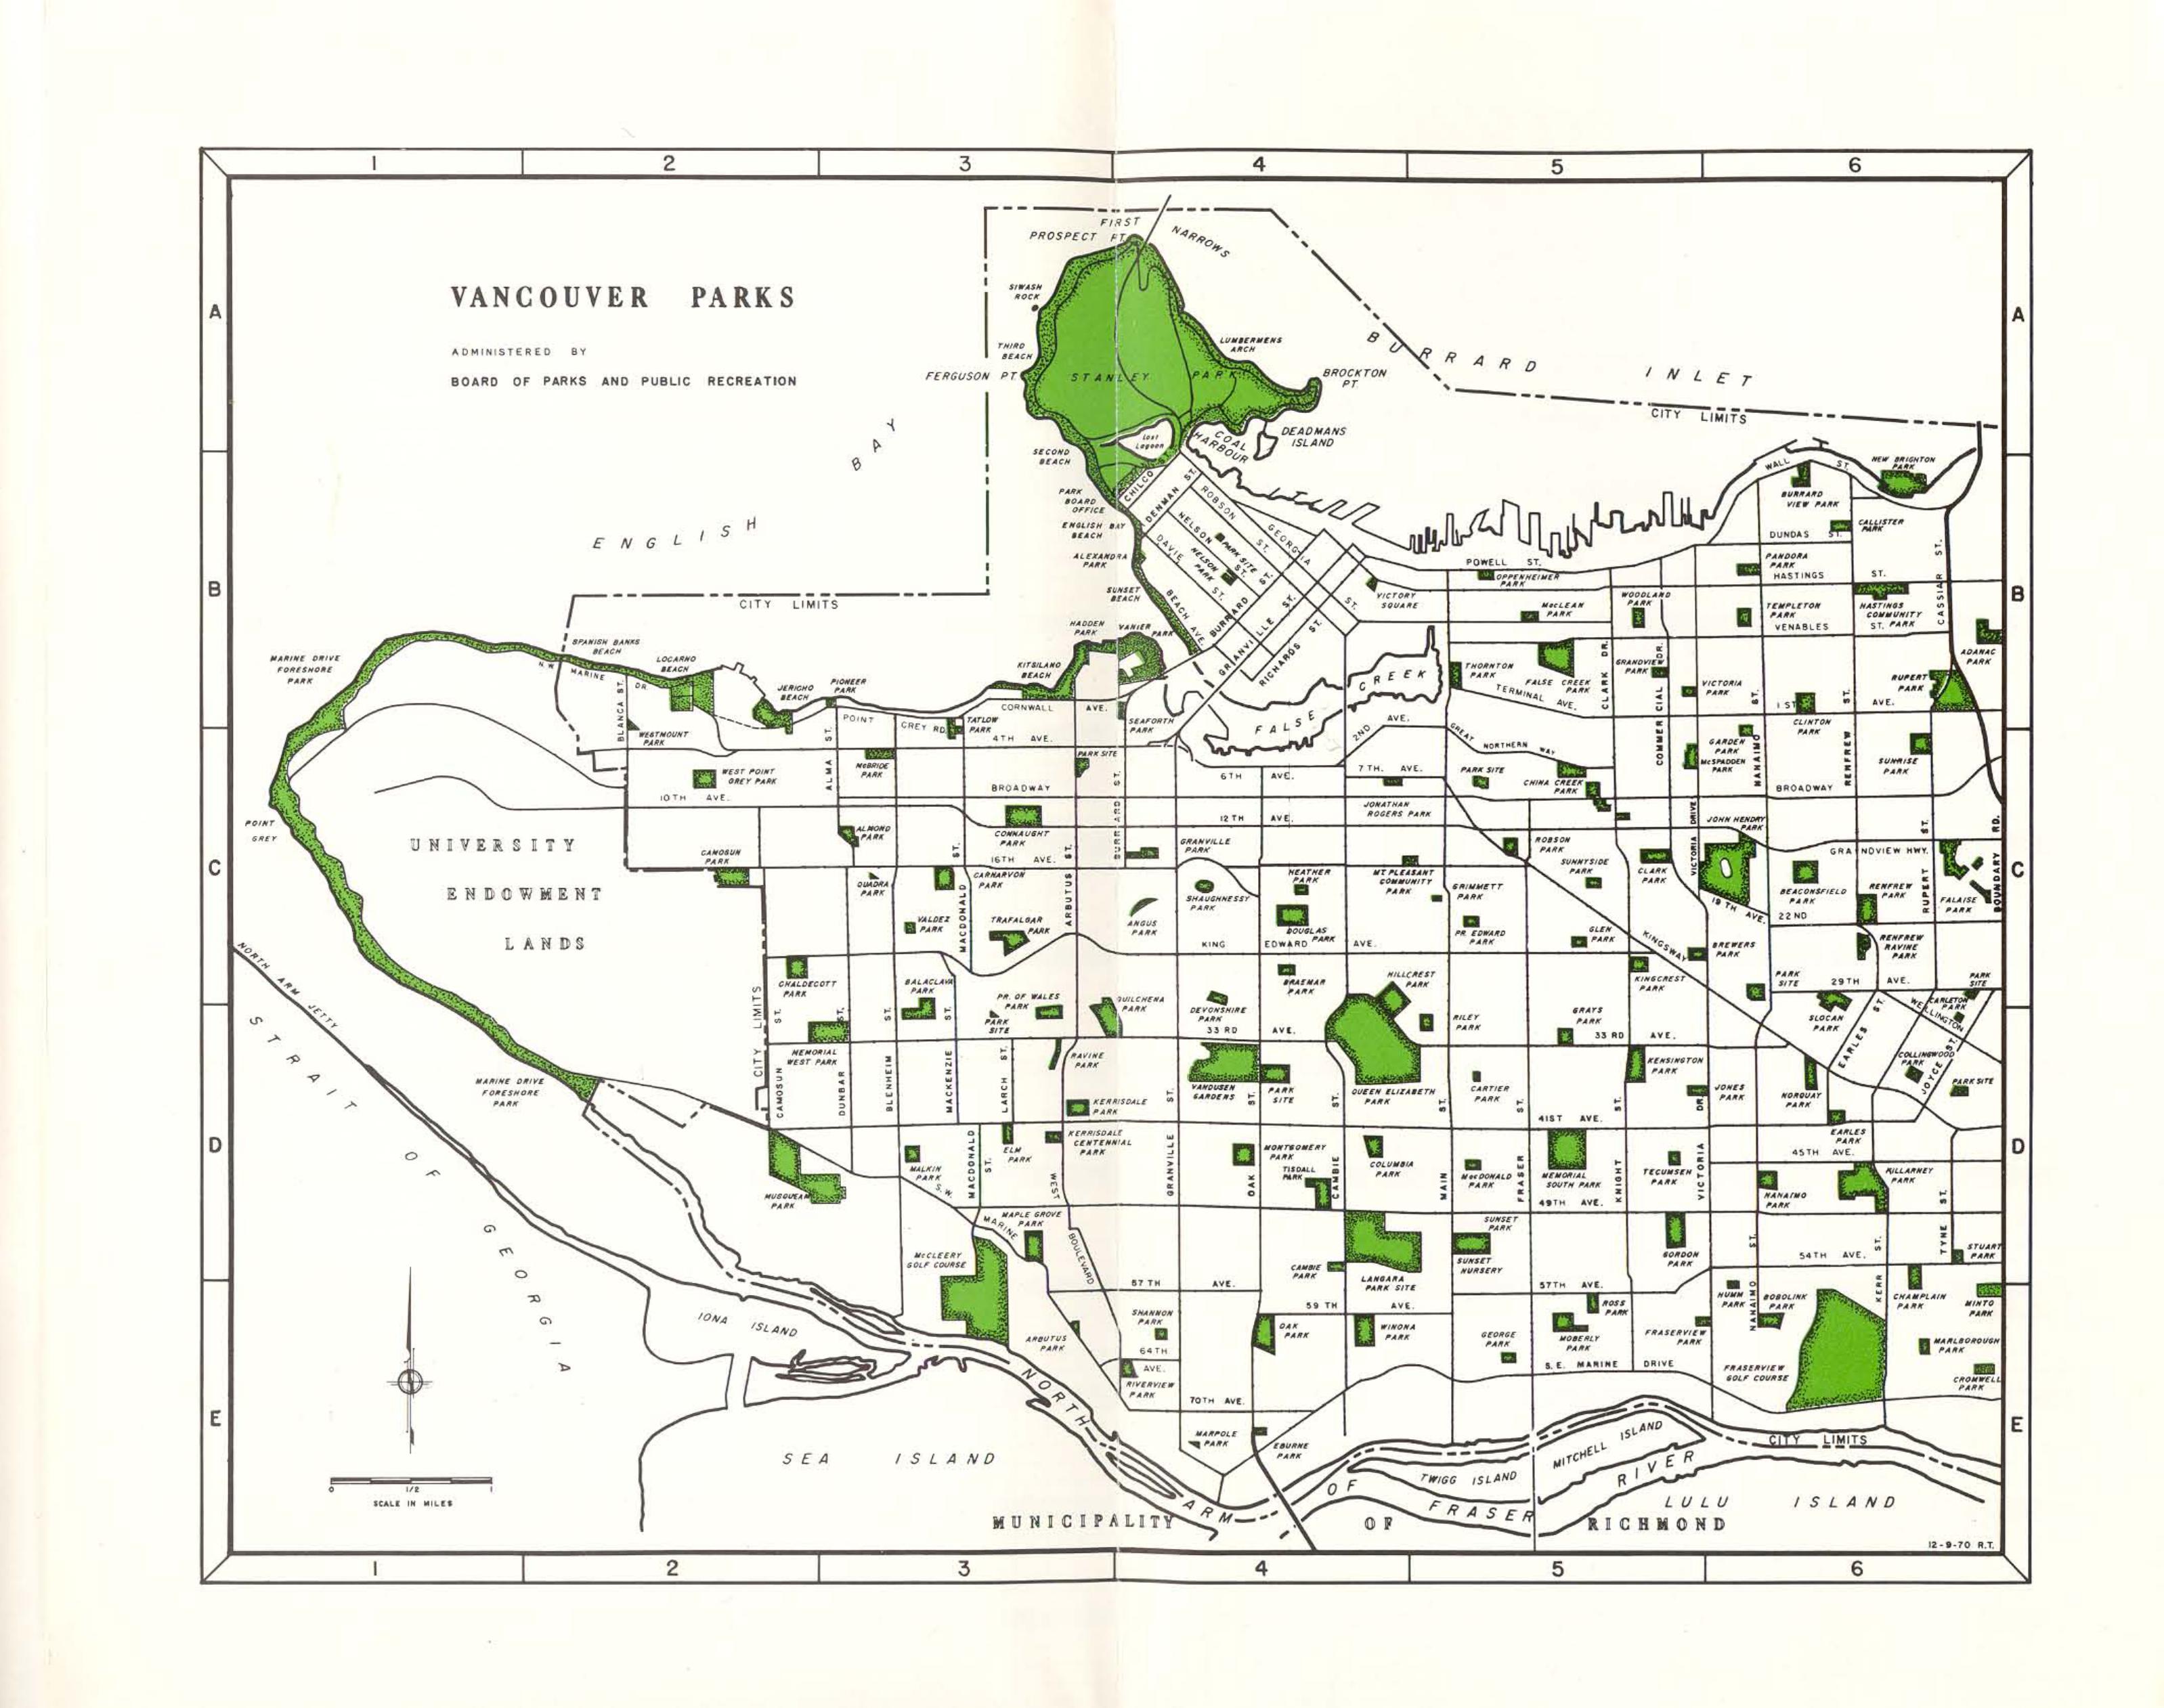
Maps of Parks
Creation or maintenance of parks may be associated with the gentrification of a neighbourhood; for example, following an increase in density of population due to condominium developments in the North False Creek area in the 2000s, some residents complained of decreased livability due to not enough amenities to support the growing population. In response, the City of Vancouver re-established park space (Tolfo & Doucet, 2022).
Unfortunately, we could not provide access to any images of park maps from Koerner Library. The following map is available through the City of Vancouver’s Parks, Gardens, and Beaches website, or as a PDF. Remember that you may be able to find more relevant maps in the Additional Maps page.
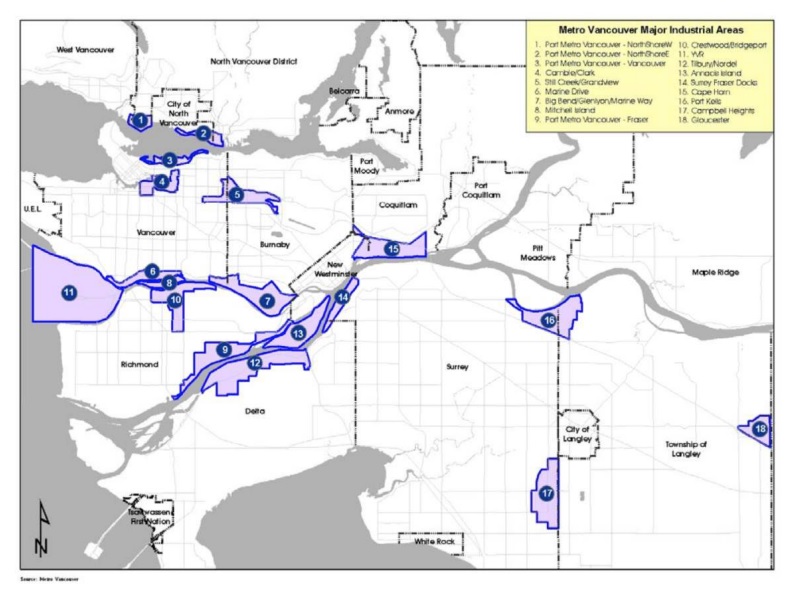
Industrial and Noise Pollution Maps
Areas with industrial sites, pollution (including noise), or other externalities that are deemed “unpleasant” are often areas that are targeted by city planners for gentrification(Ley & Dobson, 2008); especially in the post war years of the 1960s and 1970s, public opinion turned against some of Vancouver’s oldest, often industrial neighbourhoods, and they were targeted for redevelopment (Tolfo & Doucet, 2022).
Unfortunately, we could not provide access to any images of industrial or noise pollution maps. The following map is available through the Port Vancouver’s Land Use Planning website, or as a PDF. Remember that you may be able to find more relevant maps in the Additional Maps page.


