Framing an understanding of Geographic Information Systems (GIS)
John Snow

By [1] Originally from en.wikipedia; description page is/was here., Public Domain, Link

By John Snow - Map of the book "On the Mode of Communication of Cholera" by John Snow, originally published in 1854 by C.F. Cheffins, Lith, Southhampton Buildings, London, England.
The uploaded images is a digitally enhanced version found on the UCLA Department of Epidemiology website., Public Domain, Link
Over time, technology has evolved to allow work with geographic information to become both more advanced and more accessible
Geographic Information Today
- Satellite imagery for environmental monitoring
- Social media data for market research
- Census and demographic data for urban modelling and simulation
Geographic Information System
Just as we use a word processor to write documents and deal with words on a computer, we can use a GIS application to deal with spatial information on a computer.
Spatial Data
(machine readable)
| Raster | Vector |
|---|---|
| Pixels | Geometry |
Raster Data
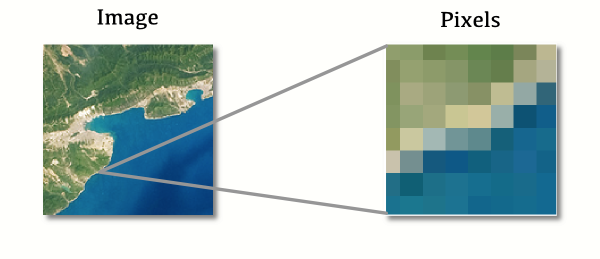
Imagery courtesy of mapschool.io
Vector Data
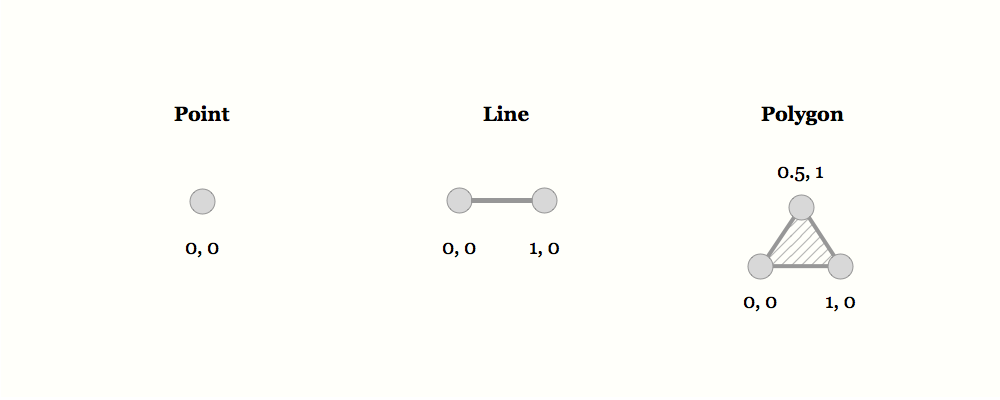
Imagery courtesy of mapschool.io
A range of GIS applications
- Utilities (tasks)
- Desktop (analyses, composition)
- Infrastructure (management, access)
Library GIS contacts:
Maya Daurio – GIS GAA
Evan Thornberry – GIS Librarian
Paul Lesack – Data and GIS Analyst